
WAEC Mathematics 2021 · try it first
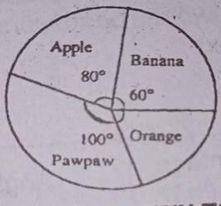
The pie chart represents the distribution of fruits on display in the shop if there are 60 apples on display how many oranges are there?
WAEC Mathematics 2021 · try it first
Log in and Smarty will explain this question in seconds.
No one has explained this one yet.
Work it out, then write how you got there. Your explanation is how the next student understands it.
Be the first to explain this question.
Log in to explain